4 MIN READ
Using Data to Determine Where to Invest for Smart Growth
When it comes to community building, having access to the right data to determine how to invest in infrastructure, funding, and more is vital for smart growth. Community decision-makers must access accurate, consumable population data to ensure they can lead sustainable growth for their people.
Currently, over 50 percent of the global population lives in urban areas, and by 2030, it is estimated that 60 percent of the world’s population will live in cities. By 2045, the world's urban population will multiply 1.5 times to 6 billion.
These insights predict great things for economic growth as long as cities can wisely navigate this level of expansion for their residents. To accomplish smart growth, city leaders must move quickly to plan and expand the right essential services, business growth opportunities, infrastructure, and affordable housing for their growing populations.
Public data, including data collected by the U.S. Census Bureau, is used by economic developers to gather insights into population segmentation. Understanding the nuances of these segments is particularly important in cities with a high percentage of college students, which can count students as residents when Census data is collected. Population shifts around academic calendars may skew data stories because key drivers of those changes aren’t present and impacted. Additionally, events like the global COVID-19 pandemic—where many college cities seemingly lost a percentage of their residents—can impact millions of dollars in funding. When looking deeper into federal and state data, the insights can craft a more cohesive picture of the story being told.
A Midwest College Town’s Expansion
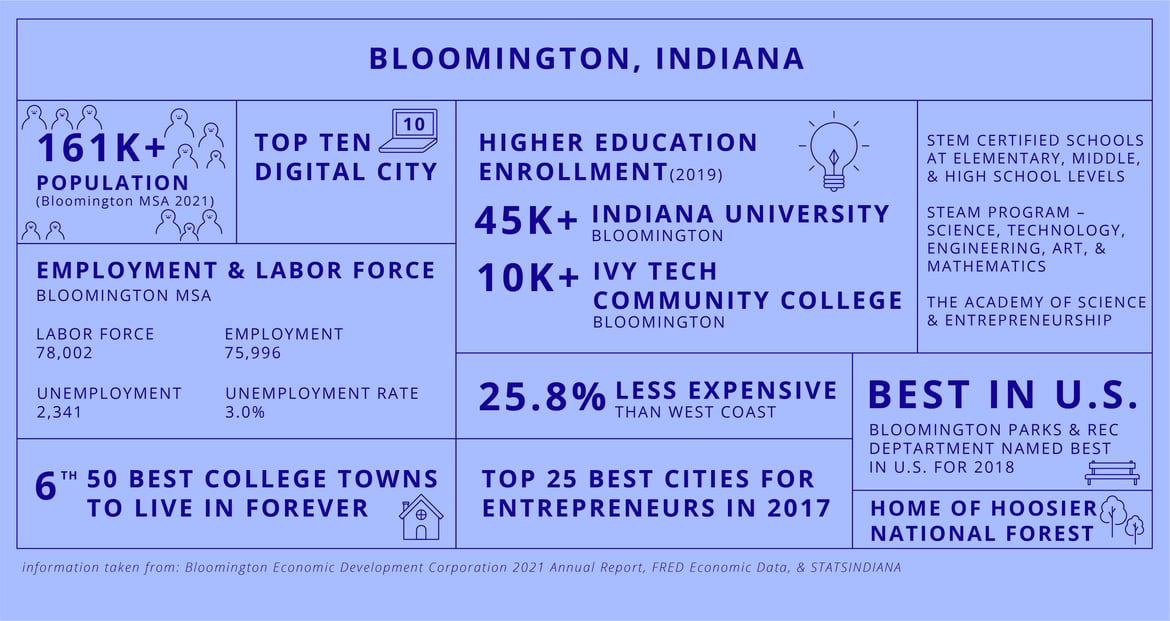
Bloomington is nestled in southern Indiana, 50 miles from Indianapolis. Home to Indiana University Bloomington—the original and largest campus of Indiana University—the city is a destination for creatives and technology enthusiasts. Unsurprisingly, the Midwest city is at an inflection point of growth and the protagonist of this data story.
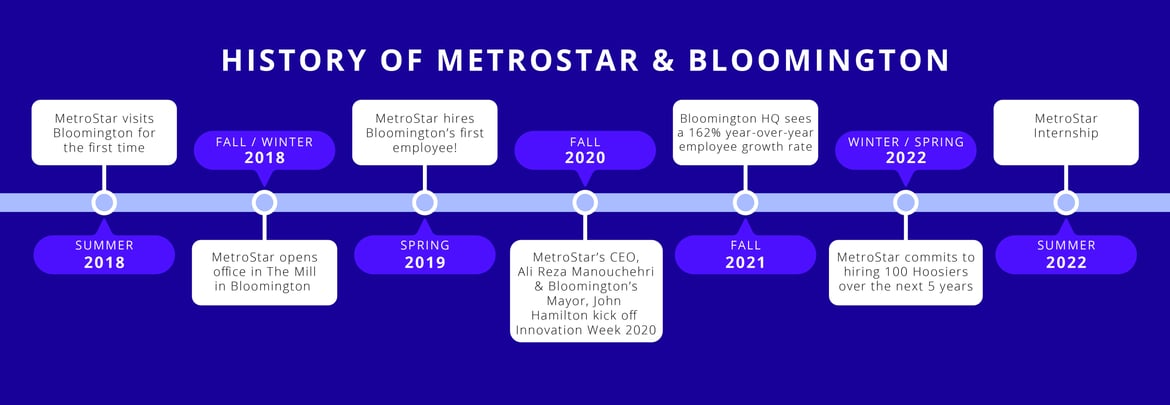
MetroStar, a leading digital IT services and solutions provider in the DC region, announced a second headquarters in Bloomington with a plan to hire 100 Indiana residents to the team by 2025. The continued advancement of the city’s growth is a passion of MetroStar and is one of the reasons why Bloomington was chosen as the city to highlight in this project.
Over the course of ten weeks, the 2022 MetroStar intern class joined a talented group of mentors to translate research and data into the delivery of an end-to-end data solution that automatically ingests data, normalizes it, and layers predictive models to visualize insights. The solution helps answer the tough economic development questions around population segmentation, helping pinpoint where to invest resources and money. While this data collection is vital and already ongoing, it currently takes many hours to manually process, analyze, and generate each of the insights cities use for planning. These restraints are burdensome for city officials and planners.
The Big Questions: How do you effectively leverage the vast amount of economic data available from the United States Census Bureau to generate insights and direction to improve the lives and growth of cities, particularly Bloomington? How can this process be simpler, faster, more efficient, and more automated for officials and planners?
To deliver the right outcomes, the team took a Human-Centered Design (HCD) approach combined with agile, iterative delivery. To understand the true problem to be solved, the team met with city planners, analysts, and technologists from the Mayor’s Office of Bloomington to understand how they approach economic planning and development and how they could benefit from a solution the team set out to build. This highly collaborative approach incorporated sprint planning, research, demos, prototyping, and customer feedback to ensure they built a platform for city planners that generate insights from large data sources quicker.
Building the Project Roadmap
MetroStar’s HCD playbook acted as an accelerator to expedite this learning process for the interns.
For success, the team aligned around the five aspects of product development:
-
Research: Conducted research with stakeholders, business owners, and end-users to understand how they work with data, their frustrations and limitations, and opportunities for improvement
-
Personas: Created personas that represent end-users and their varied needs, so features, functionality, and technology aligned with user needs and the desired outcome
-
Strategy: Created a shared vision of success for the team through a product vision that outlined the purpose, goals, and outcomes of the solution
-
Technology: Identified and integrated the technologies necessary to create the data solution that delivers insights
-
Delivery: Followed an agile process and released incremental functionality to get real-world feedback, learn from it, and improve
Meet the Team
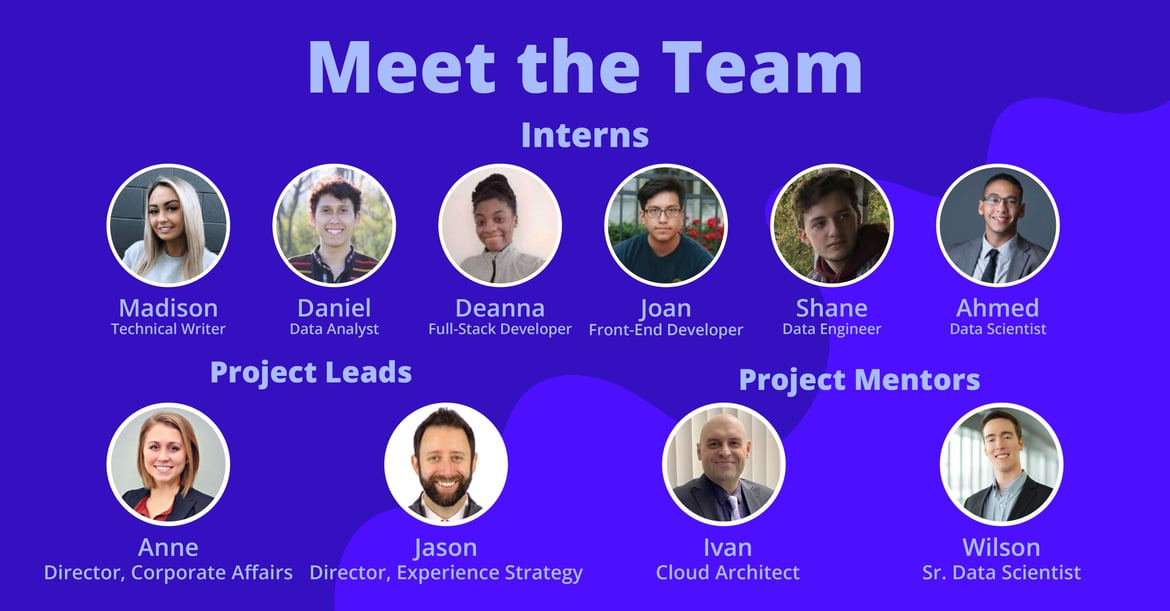
Our team of technologists are multi-disciplinary and creative. They know how to apply HCD, utilize cutting-edge technology, and implement artificial intelligence and machine learning solutions to solve some of the Nation’s toughest challenges. The internship at MetroStar is a collaborative process that brings together employees at different lifecycles of their careers. From tenured staff to inquisitive interns, a unique team was created to provide a variety of perspectives on big data problems.
MetroStar would like to thank Tableau for providing licenses for the interns to make this possible. Tableau is the leading data visualization software and is transforming how people solve data problems.
This is the first in a series of blogs. To learn more about the team’s research, data insights uncovered, and solutions provided, subscribe to the MetroStar newsletter. We’ll keep you updated once the next blog is published!
