Translating Data Analytics for Better Business Intelligence
3 MIN READ
01/18/2017 | Data Analytics

Buzzwords like “smart data,” “big data” or taking a “data-driven” approach are likely dominating conversations around the evolution of businesses. Although data-driven decision-making is becoming integral to success for organizations, the concepts behind it have been evolving for decades. In the 1960s, researchers at institutes like Harvard University develop the concept of a decision support systems based on interactive, model-driven management decision making (learn more about the history of decision support systems).
The Purpose Behind Data-Driven Decision Making
Today, data is the fuel that powers corporate engines. Organizations that harness data and began to organize, interpret, and visualize that data, outpace their competitors and more effectively implement innovative approaches. Many organizations still face the challenge of effectively translating and visualizing their datasets in order to gain the quality and reliable insights required for better decisions.
The ability to translate data into the information required to plan and execute future business strategies is the core of Business Intelligence and Business Analytics.

Three Pain Points and their Business Intelligence and Business Analytics Remedy
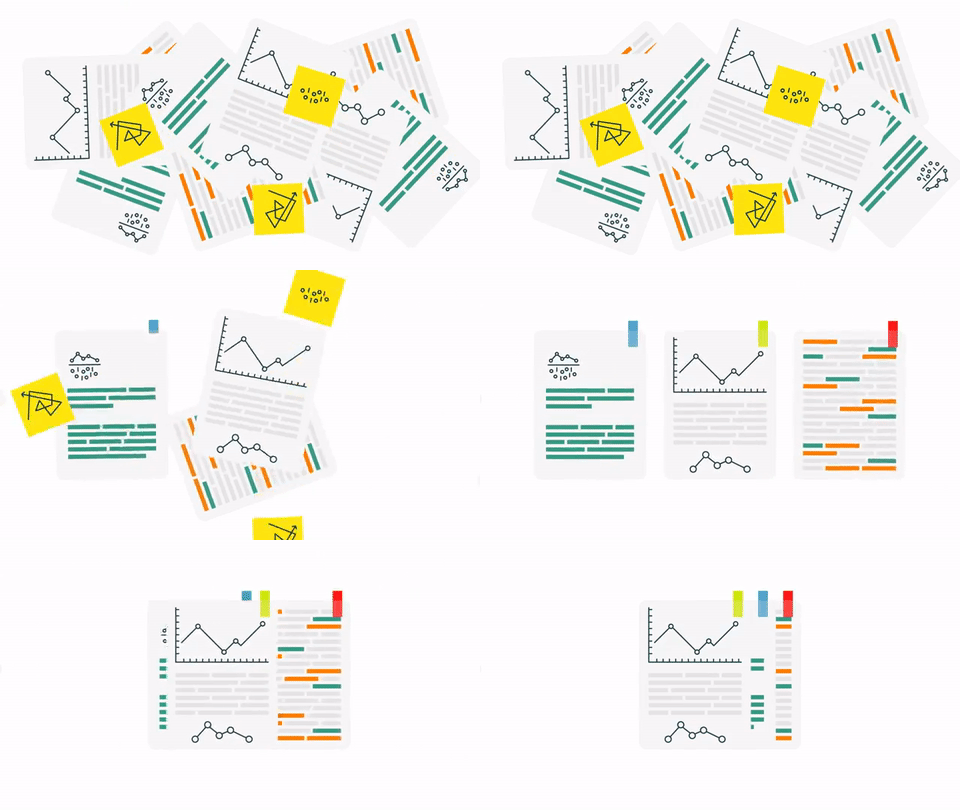
You have the bricks, but don’t have a floor plan. For more and more organizations collecting data is not the challenge. Data preparation can account for approximately 80% of the work of data scientists.
Some of that preparation includes:
• Identifying the business/product objective
• Identifying and drafting the goals and criteria for success
• Creating a set of questions for identifying correct data set

In addition to internal data collection mechanisms, the market is full of data collection tools, services, and sets available commercially or for free through open data initiatives. However, this leaves organizations with the challenge of understanding how to leverage and interpret those datasets. Don’t just be a record Keeper. Collect and start analyzing data into actionable information. Data that can’t be made into a plan is just data and is about as useful as a pile of bricks.
1. Excel overload. Don’t stunt your analytic growth. It doesn’t take long to accumulate data far beyond Excel’s capacity. As companies grow, so does the amount of data they must work with. Unify your data and leverage scalable databases like Amazon Web Services to enable real-time sharing and reduce human error from your current environment.

2. Where’s my report and what am I looking at? Reports are the crucial starting point for any analyses. Without reports, it’s impossible to generate and interpret Key Performance Indicators (KPIs), which give you the ability to display core metrics that will guide business decisions. By using a centralized Business Intelligence system for reporting and analytics, you’re able to spend more time analyzing and measuring objectives and ensuring KPIs are useful and relevant. Don’t settle for the pie chart as a KPI.

Share the Data
The responsibility for data collection for Business Intelligence and Analytics shouldn’t reside only with the c-suite executives and data analysts or scientists. Creating a culture of data collectors means that employees from all levels of the organization collect and report on data relevant to their support areas. In addition to providing the overall organization with rich data, it helps departments demonstrate their value and mitigate their weaknesses resulting in more profitable and efficient organizations.

Questions? Reach out to us!
.jpg?width=150&name=trevor-igoe%20(2).jpg)
Written By:
Trevor Igoe
Web Content Manager
you might like these too
MetroStar Integrates Salesforce for Next-Gen Manpower Management
Cloud | DevSecOps | AI/ML | Data Analytics | Our Work
Census Data Provides Insights for College Cities Sustainable Growth
Human-Centered Design | Data Analytics | Our Work
want to stay in the loop?
Never miss a thing by signing up for our newsletter. We periodically send out important news, blogs, and other announcements. Don’t worry, we promise not to spam you.

