8 MIN READ
.png)
This blog is part two of an ongoing series highlighting this research. Read more.
Bloomington is nestled in southern Indiana, 50 miles from Indianapolis. Home to Indiana University Bloomington—the flagship campus of Indiana University—the city is a destination for creatives and technology enthusiasts. Unsurprisingly, with a roaring culture and university, the Midwest city is at an inflection point of growth. Unfortunately, student-dense cities often run into roadblocks for funding and important infrastructure changes due to their transient populations, which can skew data.
When it comes to community building, having access to the right data to determine how to invest in infrastructure, funding, and more is vital for sustainable growth in a city. Community decision-makers must access accurate, consumable population data to ensure smart expansions.
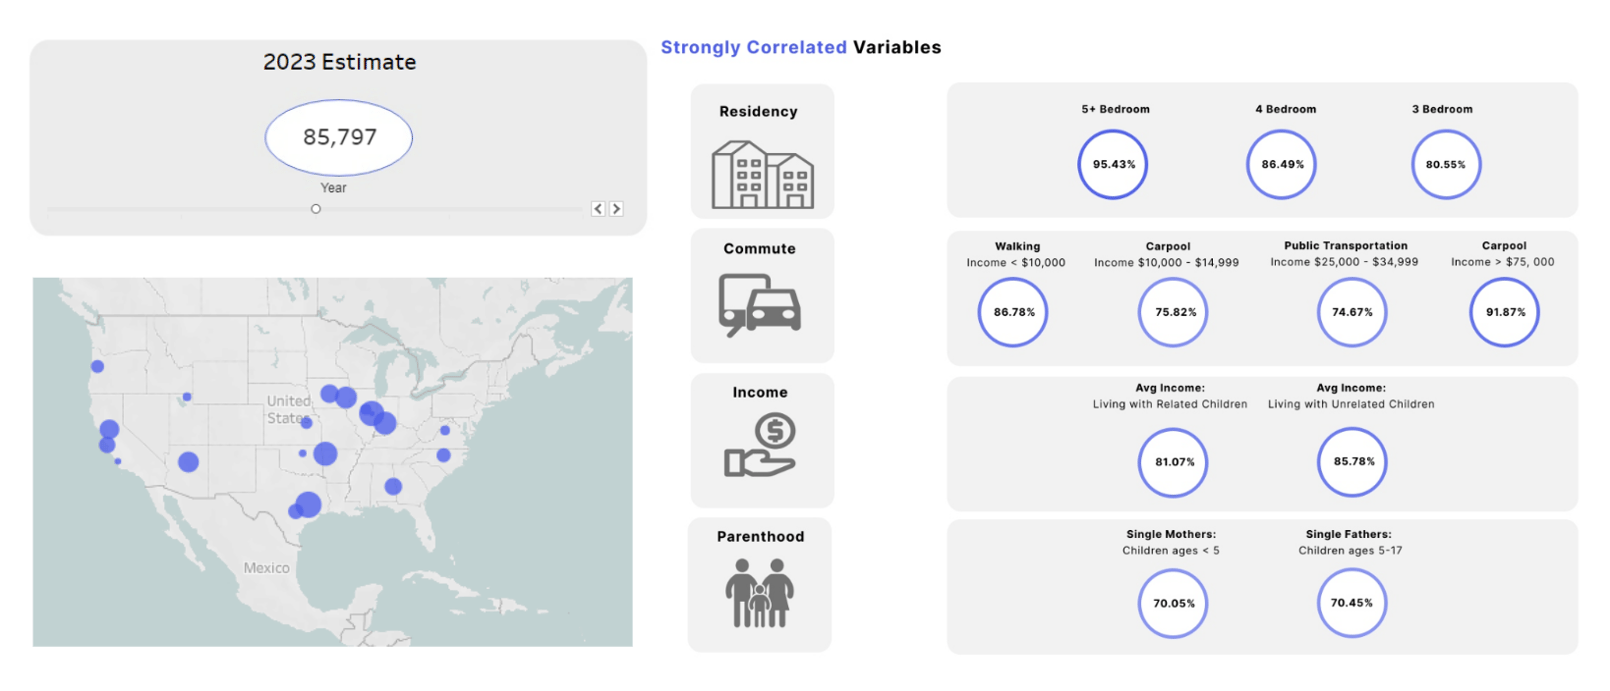
Over the course of ten weeks, the 2022 MetroStar intern class joined a talented group of mentors to translate research and data on college cities (featuring Bloomington) into the delivery of an end-to-end customer solution that automatically ingests data, normalizes it, and layers predictive models to visualize insights. The team’s solution answers the tough economic development questions around population segmentation, helping city decision-makers pinpoint where to invest resources and money.
Economic Planning and Development with Data in Mind
The team developed problem statements to aid the city of Bloomington in its economic planning and development approach. These problem statements structured an outline of what data needs analyzed and offer insights into the type of data needed to help other like-minded cities to Bloomington also grow. The team, with the aid of Tableau, visualized important data statistics around the following areas:
-
Population Segmentation: Population statistics can be challenging to analyze in cities with large universities due to the transient student population. This can make it difficult to understand a city's true trends and growth.
-
Wage Statistics: In cities with large universities, wage statistics can be challenging to analyze due to a student population who may not be working or working part-time. Wage statistics play an important role and understanding the upward or downward trends of a city’s needs.
-
Occupation Statistics: City officials need to understand the industries their residents work in and how vital industries change over time so policies, incentives, and priorities can be adjusted. This can be difficult to analyze if, on average, students change workforce trends every four years.
Population Segmentation & Bloomington Population Prediction
The team segmented the student and permanent resident population to take a deeper look at how to plan for the future. This allowed the team to understand Bloomington’s permanent resident population total while still analyzing the population size of students. With this segmentation, Bloomington officials can better understand the comparison between the two populations and whether it's increasing or decreasing. By identifying the differences in trends between residents and college students, Bloomington can make more informed planning, enforcement, and policy decisions.
The team used the U.S. Census Bureau’s 2009-2020 American Community Survey (ACS) 5-Year data, with U.S. population variables selected from the social, economic, demographic, and housing characteristics. Out of the data that Census provides, the 5-Year data is more granular on a geography basis and looks further into the detail around demographics. From this data, the team generated visualizations in Tableau showing trends and insights and, by using college towns with similar makeups to Bloomington and Census ACS 5-year data, the team forecasted population changes for the next five years.

Standout Overall Population Findings:
-
The permanent resident population of Bloomington, IN, grew from 35,726 residents (2009) to 49,258 residents (2020).
-
From 2009 to 2010, there was a 10 percent rapid increase in population compared to 2010-2020, with steady growth averaging at .76 percent per year.
-
In the past decade, the resident population drastically increased by ~37.88 percent, whereas the student population increased by .49 percent.
-
Overall total population over the past decade has increased by 19.31 percent.
Understanding Wage Statistics in Bloomington
Due to the complex nature of student incomes, wage statistics in a university-dense population can be difficult to analyze. Students often take on a variety of part-time or full-time employment, while others are not working but are supported by other sources such as family allowances or student loan reimbursements. Data collected from the ACS 5-year survey’s three sections (poverty levels, employment status, and income of residents) was used to better understand wage statistics.
Note: The ACS 5-year data does not have a dominant wage category.
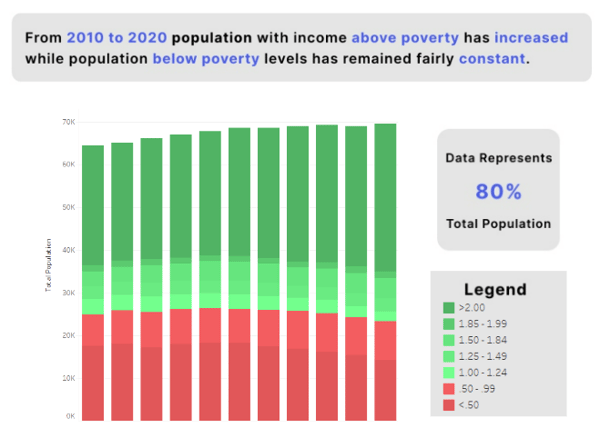
Standout Data Insights on Poverty Levels in Bloomington:
-
Distribution of poverty levels largely changes when areas see an increase of higher income households above $40,000.
-
In the Bloomington area, minors and residents living below the poverty level have remained constant from 2009-2020.
-
There has been a sizable increase in Bloomington residents living above the poverty level over the years.
-
Poverty levels are contained within the student population at about 75 percent, while residents make up the other 25 percent

While data tells a story, so does the nuance of the realities behind students' income, which is important to acknowledge when making decisions. Income in college cities can reflect a parent's income (allowances, etc.) which can be tied to a different city or state's data. Additionally, students in Bloomington may work in a different city or state than where they spend their money (i.e., on living costs like rent, food, and transportation). These irregularities can affect how money is allocated to a municipality by skewing data results. A platform like the one the team created allows for a better look at income segmentation and tracks income trends, but a follow-up with additional, non-public data would be needed to make conclusive insights. Regardless, the insights generated from poverty levels within Bloomington tell officials that the resident rate is gradually increasing, especially among residents earning higher wages.
Standout Data Insights on Income Ranges in Bloomington:
-
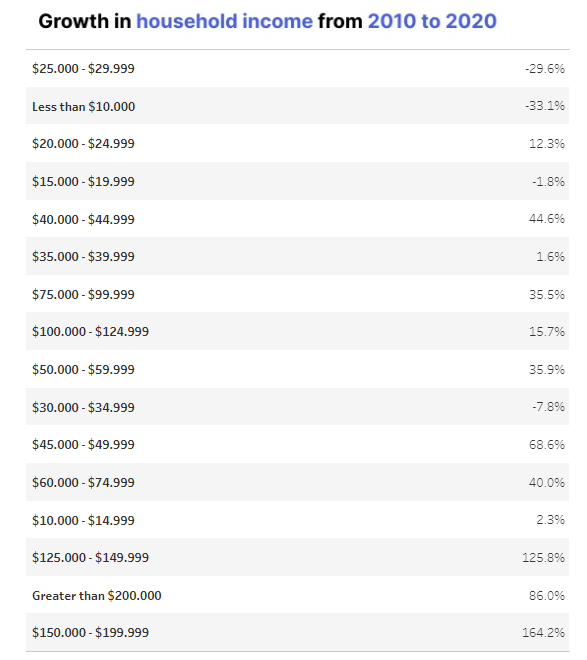
Income has remained steady from 2009-2020. The only significant increase was the $40,000 - $100,000 income range.
-
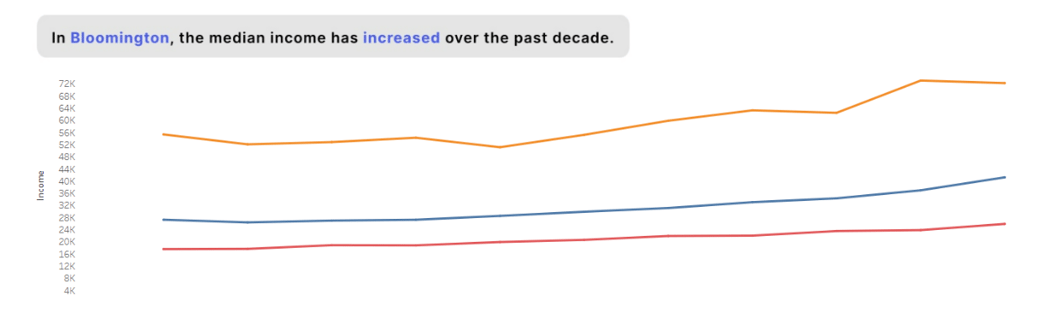
The median income has been increasing for family households.
-
Family households making $15,000 - $ 45,000 has been decreasing (can be related to median income increasing).
-
There is a decrease in overall households with income less than $10,000 from the part-time work population.
-
Commuting patterns have shifted based on income
-
Walking is crucial for those making less than $10,000.
-
Carpooling is crucial for those making $75,000 and up and those making between $10,000-15,000.
-
Public transportation is crucial for those making $25,000 and $35,000.
-
-
Income growth is proportional to population growth. As the population increases, income tends to increase.
Standout Data Findings on Employment Status in Bloomington:
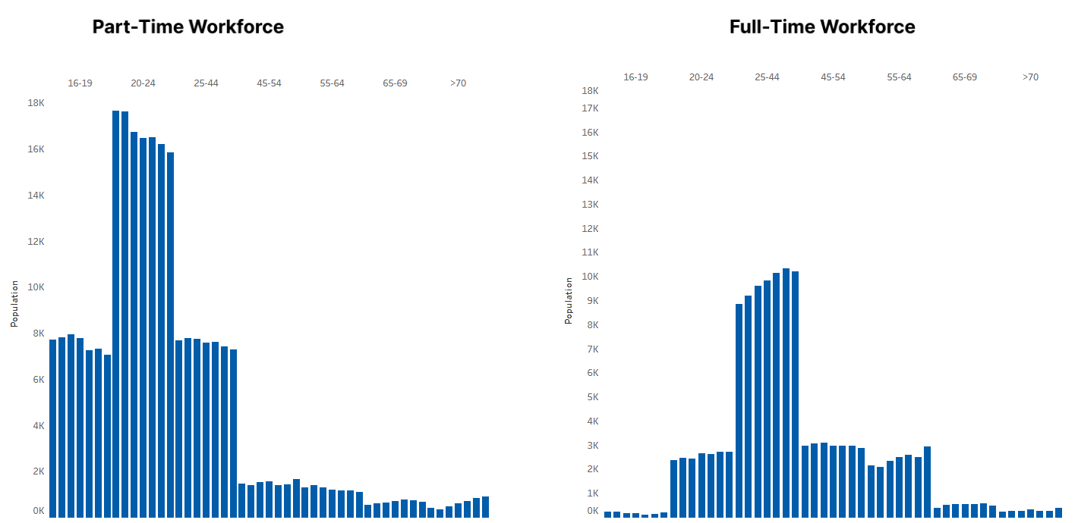
The team looked at work status by employment (part-time ( < 30 hours), full-time ( > 30 hours), unemployed).
-
Part-time employment has decreased for both age groups, 16-19 and 20-24.
-
Part-time workers make up most of the population.
-
There is an increase in employment for the age group 25-44.
Looking at the overall household data, the largest portion of Bloomington's workforce is working part-time (in roles such as retail and hospitality). This finding relates to Bloomington's economy being tied to university students, as the city needs these people to fill seasonal or part-time positions that come with the university's presence in the city.
However, data shows a drop in employment for the age groups in which students are primarily comprised (20-24 years old). The increase in employment for 25 to 44-year-olds is likely due to the influx of new residents with established careers and full-time job salaries. This insight was also shown in the recent increase of Bloomington residents living above-poverty levels.
While Bloomington's population is concentrated around individuals working part-time, the student population is decreasing—whether from rising tuition, cost of living, or the pandemic—and the city may see an impact on its overall workforce. The student population decrease relates to the drop in "income less than $10,000" due to part-time jobs in the area making that average rate.
Understanding Occupation Statistics in Bloomington
The occupation status of residents is important for city officials to understand because the industries their residents work in change over time. Infrastructure and other state-funded planning should be adjusted because of occupation data so that future decisions will best reflect residents' needs and interests.
Standout Insights on Occupation Statistics in Bloomington:
-
Over ten years, there has been an overall income growth in all industries in Bloomington.
-
Transportation-based workers' average incomes have gone up drastically from $9,000 to $22,000.
-
Many occupations experienced growth in their industry by over 20 percent.
-
The largest occupational workforce with the highest income and the most robust growth includes:
-
Healthcare diagnosing and treating practitioners
-
Computer and mathematics-based positions
-
Financial and operations-based positions
Looking to the Future
Using the open-source data from the U.S. Census Bureau, the team pointed Bloomington officials in the right direction regarding how to plan for growth and where future economic investments should be made. While helping Bloomington, the team also made a platform for Census data that is readable and more accessible for any user (not only data scientists) who wish to plan for their city's future.
As the world grows, so does the data around us. This makes it vital to have tools and resources that help you and your teams understand the vast amount of data needed to make smart decisions for achieving your mission. If you’re interested in the demo and technology behind collecting and analyzing data for city growth, our tenured experts are ready to walk you through our process and share how our work can help any project grow.